View Your Images In The World Wide Telescope With Montage
Contents
Purpose of this Tutorial
The WorldWide Telescope (WWT) (http://www.worldwidetelescope.org/) is a visualization tool for astronomical data, originally developed by Microsoft Corporation The American Astronomical Society (AAS) assumed responsbility for its management in January 2016, and at same time released the code with an Open Source license. The WWT offers Windows and Web Client interfaces, which allow users to pan and zoom across the sky, and disover and visualize image surveys and pointed observations.
Astronomical image data are almost always in the form of FITS (Flexible Image Transport System) files in a variety of sky projections, while WWT only consumes JPEG/PNG images in a custom projection called TOAST and tiled/named in a specific way. Montage supports the transformation of FITS data images with any standard astronomical projection into the WWT format and tiling scheme and this tutorial shows all the steps involved.
The data used in this tutorial comes from the Planck archive at IPAC. It started out life as a HEALPix FITS table, which we processed into image form using a process described in the Montage and HEALPix tutorial. We provide access to the image data we used in the end-to-end example at the end of this tutorial.
Here is an Aitoff projection map of the Planck data (for more on this, see the HEALPix tutorial):

Important Note: To use your data with the web version of WWT requires that the data files are URL-accessible under a web server like Apache. If you do not have direct control of such a location, you will have to make arrangements with someone who does.
Nomenclature
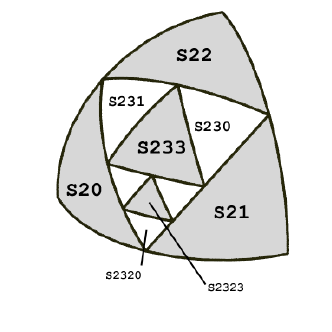
HTM (Heirarchical Triangular Mesh) is the basis for TOAST. It is a tessellation of the sky popularized in astronomy by the work on the Sloan Digital Sky Survey at Johns Hopkins University. The tessellation starts off with the sphere divided into octants with each octant running from a pole to the equator and 90 degrees along the equator. These triangles can be subdivided into finer and finer grained sub-triangles by inscribing each with a smaller triangle whose vertices are the side midpoints. See here for more detail on HTM.
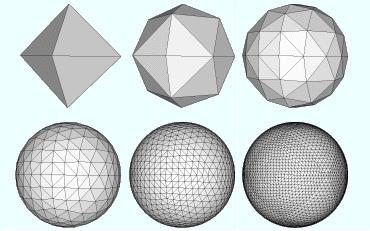
TOAST (Tessellated Octahedral Adaptive Subdivision Transform) is the map projection used to import all-sky data into WWT. Essentially, each TOAST pixel is a pair of HTM triangles. TOAST also implies an organization of files: All the TOAST data imported by WWT is in the form of 256x256 PNG (or JPEG) images. The highest level of these covers the entire sky. The next level is a set of four images covering longitude quadrants (N-S pairs of HTM octants) and so on to as fine a resolution as is appropriate for the data. See here for more on TOAST.
TOAST as a WCS Projection |
Top |
When viewed as a projection, HTM looks quite different from "normal" examples like gnomonic and simple cylindrical. There the transformation between pixel sky coordinates can be expressed by specific formulae. Determining what HTM cell or TOAST pixel corresponds to which location on the sky always requires starting with the base level HTM octant triangles and "drilling down"; finding arc midpoints, connecting them with great circle segments and determine which subcell we want based on vector dot- and cross-products.
All this seems like an awful lot of computation, especially when it has to be done for every corner of every pixel in an image. But in fact, given the simplicity of these vector operations, the total amount of computation involved is not that different from some existing "formulaic" projections, some of which require iterative solution or polynomial expansion with a large number of terms.
Another area where HTM/TOAST differs is that there are only a discrete set of pixel scales that are possible. We always start with the whole sky and we always subdivide the same way. So parameters from WCS like CDELT/CD (if they exist at all) are only informational with the "real" scaling being controlled by the HTM level parameter (which we have captured as keyword PV2_1).
Montage uses the WCS library distributed by SAO as part of their wcstools package. We have extended this to support TOAST (projection type TOA). Users must therefore call the version of the WCS library bundled with Montage.
TOAST FITS Images |
Top |
Since Montage handles TOAST as a fully-function projection, the files produced are standard FITS images. They are still in data units and can be used by Montage as the basis of further reprojection and used as a set for background normalization, coaddition into mosaics, and so on.
SIMPLE  =                    T
BITPIX  =                  -64
NAXIS   =                    2
NAXIS1  =                  256 / All WWT tiles are
NAXIS2  =                  256 / 256x256 pixels.
CTYPE1  = 'RA---TOA'
CTYPE2  = 'DEC--TOA'
CRPIX1  =             -3072.50
CRPIX2  =             -1536.50
PV2_1   =                    5 / HTM level for this tile.
XTILE   =                   12 / X and Y tile indices
YTILE   =                    6
CDELT1  =                 1.00 / The rest of the header
CDELT2  =                 1.00 / is really just boilerplate.
CRVAL1  =                   0. / Don't let the values get
CRVAL2  =                   0. / modified as it might affect
PC1_1   =                 1.00 / proper processing.
PC1_2   =                 0.00
PC2_1   =                 0.00
PC2_2   =                 1.00
END
Here is an example TOAST FITS header. We have devised a formalism which is "good enough" for our principal use case of building tiles for use in WWT, but this may change somewhat if this TOA projection is formally incorporated into the FITS WCS framework.
Items to note:
- As mentioned earlier, the HTM level is given in keyword PV2_1.
- TOAST tiles (for WWT) are always 256x256 and are arranged in a regular XY array. We have included the "tile coordinates" in the parameters XTILE and YTILE, though these are not used anywhere in any computation. This is purely for informational purposes.
- The parameters CDELT, CRVAL, and the PC matrix are all fixed boilerplate (but for our use of the WCS library need to have these values.
- The CRPIX values are important and represent the pixel offset from the first pixel in our file and the edge of the "untiled" image for this HTM level (e.g., -256 * XTILE - 0.5).
- There is nothing to prevent this being used with datacubes (e.g., with wavelength as a third dimension) though WWT does not support such cases and the data would have to be cast into a single plane when generating TOAST PNG files.
Reprojecting to TOAST using Montage |
Top |
Again, TOAST is a fully functional projection as far as Montage is concerned, so operations that work for any other projection work for TOAST as well. As long as the FITS header describing the TOAST file conforms to the above, both mProject and mProjectQL can be used to project to TOAST from any other projection (or from TOAST to any other for that matter).
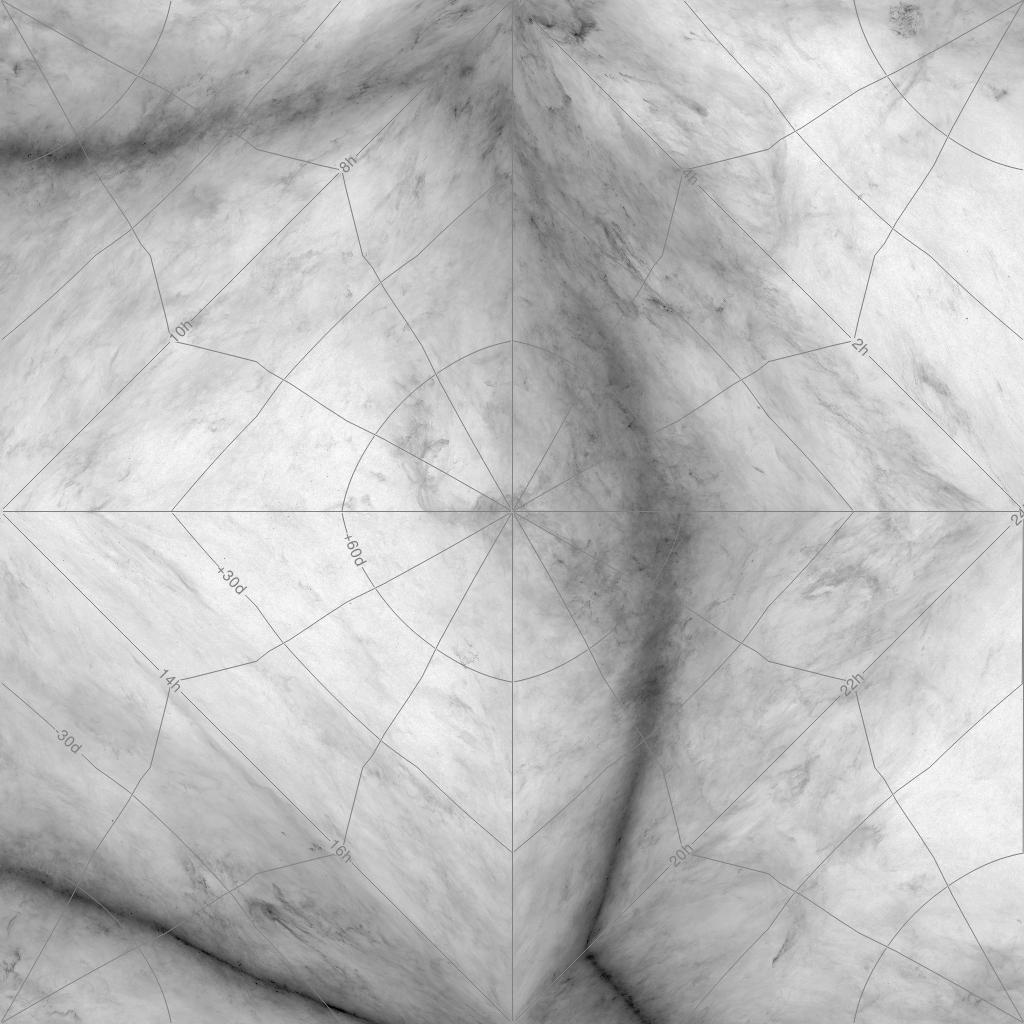
While TOAST is targetted at visualization through WWT, the TOAST images themselves are not particularly well suited for direct inspection. This is most obvious in an all-sky image such as the one on the left. The image is mirror-imaged relative to a normal all-sky projection and there are serious discontinuities in the slopes of curves (as illustrated by the RA, Dec lines). Nevertheless, areas are reasonably well preserved and distances as well and this plus the feature that all pixel boundaries are identically great circle segments make it well suited to its primary task.


Generating PNG Images from TOAST FITS |
Top |
WWT can only consume PNG/JPEG files, not FITS files. The TOAST file we show above is beyond what WWT can handle directly since it was not constrained to the WWT tile scheme: it is the whole sky at HTM level two (1024x1024 pixels) and therefore contains 4x4 TOAST tiles.
The Montage module mViewer can be used to turn the TOAST FITS files into PNG (or JPEG) form. mViewer gives you a range of options as to how to stretch the data and what color scheme to use. It even allow you to combine three images into a full-color composite. For the above, we used a reverse grayscale color table and a gaussian histogram equalization stretch. Getting exactly the stretch you want is always subjective, so the examples we show are only a starting point for experimentation.
When making a set of tiles, there is an added complication. Left to its own devices, mViewer will generate a different stretch for each image, based on the histogram of data value in that image. In order to have the same stretch for all the images (all the TOAST tiles in this case for all the HTM levels) we use a separate Montage module, mHistogram, and one all-sky image (like the one above) to determine a single stretch lookup table that will then be applied to all the tile images uniformly (by telling mViewer to use that stretch explicitly).
Taking this approach, we get a seamless of set of PNG tiles to send to WWT. Here is a set of tiles if increasing resolution covering the part of the sky containing ρ Ophiuchus done in this way (&rho Oph is in the lower left quadrant of the first image, lower right for the second, then lower left and finally upper left). TOAST images when viewed in this way are mirror image the way the sky appears.
The TOAST File Set |
Top |
WWT expects to find a set of 256x256 PNG images and processes whatever subset makes sense for the region and zoom it is showing. It starts with the single all-sky image for level 0, four for level 1, then 16, 256 and 1024 for levels 3, 4 and 5. For the example we are using here, we only go a far as level 5 since that corresponds to the intrinsic resolution of the original data.
So to support WWT, we need to produce a total of 1365 256x256 images. WWT supports a couple of naming conventions for these files. We generate ours in a recursive Z-order pattern so the most natural convention for us gives names to the images on the left of "Planck.png" (for level zero), then "Planck2.png", "Planck23.png", "Planck232.png" and "Planck2320.png".
Setting up the processing for all this gets old fast, so we include a few little utilities (exact calling syntax will be given in the end-to-end example at the end of this tutorial):
- mHdrWWT / mHdrWWTExec. In order to run mProject/mProjectQL, we need a header
like the one above. Since the set of headers for any given HTM level is
fixed (unless we want to include non-projection information) we only need
to generate these once. mHdrWWT will create a TOAST tile header file given
a tile ID (the Z-order digits like "2320") and an output file name.
mHdrWWTExec will create a complete set of such headers down to some maximum level given the level and a directory to write to. The names created are fixed in the form "tile2030.hdr".
- mProjWWTExec. All three of the executive utilities described here use the same recursive scheme to populate the tree of tiles needed. Above we produced generic headers for the tiles. mProjWWTExec runs mProjectQL to reproject an all-sky input image from some other source into a set of FITS tile images using these headers. It writes all these into a directory given an an argument.
- mPNGWWTExec. Finally, the FITS files need to be converted to the PNG images WWT will use. This executive runs mViewer for each FITS file, using a pregenerated histogram as described above and a color table given as argument. It also has a "full color" mode where three sets of arguments are used to create color composites.
These utilities are not general; they assume the source data is from a single file so no mosaicking is needed as part of the processing. For more complicated situations, you can use the source for the utilities for guidance in designing your own workflow.
Setting up Data for WWT Use |
Top |
We are concentrating on the web version of WWT for this tutorial as we expect this is the mechanism most providers will use to get their data to the public. The Windows tool probably provides a little more flexibility, such as direct use of local files. For the web version, however, you must copy the PNG files generated above to a URL-accessible location.
In addition, you have to create an XML file describing this "collection", also as a URL-accessible file. There is a fair amount of flexibility in this XML but here is a basic template that works:
<?xml version="1.0" encoding="UTF-8"?>

<Folder Name="Montage Tests"
        Group="Explorer"
        Searchable="True"
        Type="Sky"
        Thumbnail="http://montage.ipac.caltech.edu/workspace/Planck/icon/color_AIT_small.png">


  <ImageSet Generic="False"
            DataSetType="Sky"
            BandPass="microwave"
            Name="Planck 857 GHz"
            Url="http://montage.ipac.caltech.edu/workspace/Planck/857/Planck{Q}.png"
            BaseTileLevel="0"
            TileLevels="5"
            BaseDegreesPerTile="180"
            FileType=".png"
            BottomsUp="False"
            Projection="Toast"
            QuadTreeMap="0123"
            CenterX="0"
            CenterY="0"
            OffsetX="0"
            OffsetY="0"
            Rotation="0"
            Sparse="False"
            ElevationModel="False"
            StockSet="False">

    <ThumbnailUrl>
       http://montage.ipac.caltech.edu/workspace/Planck/icon/Planck857_AIT_small.png
    </ThumbnailUrl>

    <Credits>
       Montage reverse grayscale example made from Planck HEALPIX 857 GHz data.
    </Credits>

    <CreditsUrl>
       http://montage.ipac.caltech.edu/
    </CreditsUrl>

  </ImageSet>

</Folder>
A few notes on this XML:
- We only show one <ImageSet> here; in our actual data we have several (one for each Planck
wavelength and on color composite).
- The thumbnail images referenced were also generated by Montage using the same input data and an Aitoff
(AIT) header:

- The choices of subdirectory names here are ours, not WWT's.
- The part WWT cares about is the tile naming expansion. This is controled by the {Q} in the tile
URL template (which indicates we are using a nested quadrant scheme), the QuadTreeMap parameter ("0123")
which indicates the ordering we used, and the TileLevels (5), which says how deep we went.
- The rest of it is boilerplate as far as we are concerned, though you may have reason to revisit
this for you specific application.
Once you have put the data in a URL-accessible place, direct testing of access is easy, since you can retrieve and view individual tiles by entering their address in a browser. For instance, the highest resolution ρ Oph time we show above can be accessed (exactly as WWT will) at
http://montage.ipac.caltech.edu/workspace/Planck/857/Planck2320.png
and you can poke at all the other tiles the same way.
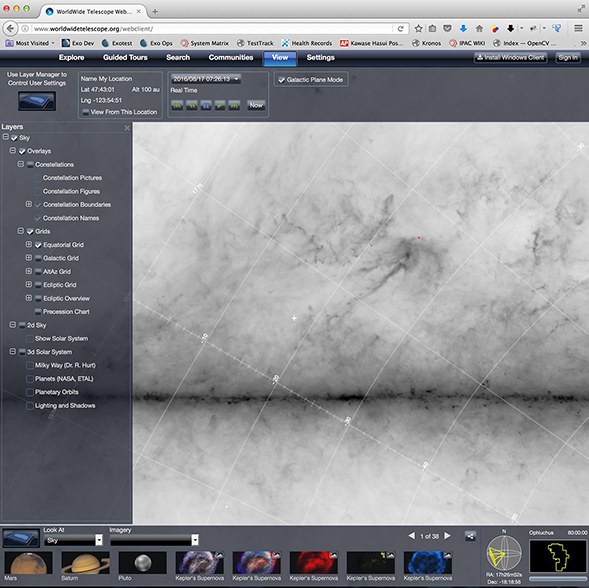
At this point, you can load your data into WWT by bringing up the WWT interface
http://www.worldwidetelescope.org/webclient/
Opening the menu item
Explore / Open / Collection ...and entering the URL of your XML file. Ours would be
http://montage.ipac.caltech.edu/workspace/Planck/planck.xml
An End-to-End Example |
Top |
This example creates a complete tile set for WWT starting with the the Planck data described above. To fully complete it requires that you have access to file storage that is URL-accessible by www.worldwidetelescope.org. Specifically, the XML file you create in Step 8 is passed through a service on that machine rather than being used directly in the WWT client.
None of the directory and file names used here are required, though if you use something else you will have to remember to change those names wherever referenced.
Step 1 Setting up working directories:
Create a directory (e.g., "PlanckTiles") to contain all the working files and "cd" to it. Then create the subdirectories "hdr", "fits" and "png" which will each eventually contain 1365 files:
   mkdir PlanckTiles
   cd PlanckTiles
   mkdir hdr fits png
Step 2 Getting the input data:
The input image used by this tutorial can be downloaded here (400 MByte FITS file). Move it around in whatever way is easiest for you; if you have "wget", for instance, you can use:
wget http://montage.ipac.caltech.edu/docs/WWT/images/Planck857.fits
Step 3 Generating tile headers:
As described above, the FITS headers needed for the WWT tiles can be generated using:
mHdrWWTExec 5 hdr
The first argument is the maximum HTM level we want (~1 arcminute, which corresponds to the Planck data resolution).
Step 4 Generating tile FITS images:
This is the step that will take the longest, as it involves reprojecting the original Planck image into 1365 256x256 tiles of various resolutions. You have to be patient and let it finish:
mProjWWTExec -d 1 5 Planck857.fits Planck hdr fits
Here we've turned on debugging at level 1, which for this program prints out each of the mProjectQL commands as it goes so you have something to watch while you wait.
The second argument (5) is the maximum HTM depth we want, followed by the input FITS file name, a prefix string to use for the file names, where to find the header template files (from step 3) and where to put the output FITS files.
Step 5 Generating tile PNG images:
Before generating the tile PNG files, we need to decide on a data stretch. As we said earlier, this is subjective, so the choices here were reached through trial and error. See the documentation on mHistogram/mViewer for more detail on what the parameters mean (or try out some different values yourself).
Once we have the stretch, we can generate the PNG files:
   mHistogram -file Planck857.fits min max gaussian -out Planck857.hist

   mPNGWWTExec -d 1 1 5 Planck fits Planck857.hist png
Step 6 Generating a thumbnail all-sky image:
You can use any image you want for the thumbnail that will be displayed in the WWT interface associated with your data. We've opted for an Aitoff all-sky version of the Planck data itself. This is just a regular reprojection and covered in other documentation (see here), so the steps are just outlined without comment:
   mProjectQL Planck857.fits Planck857_AIT.fits AIT.hdr

   mViewer -ct 1 -gray Planck857_AIT.fits -histfile Planck857.hist -out Planck857_AIT.png

   mShrink -f Planck857_AIT.fits Planck857_AIT_small.fits 90

   mViewer -ct 1 -gray Planck857_AIT_small.fits -histfile Planck857.hist -out Planck857_AIT_small.png
The first PNG file is really just for context; it gives you a reference for comparison in evaluating the thumbnail and the tile PNGs.
Step 7 Installing in a URL-accessible location:
The XML file describing your tile collection will have to reflect your server setup, so you first have to decide where you are going to put things on your machine. While not absolutely necessary, it is probably best to put a copy of the ./png directory, the thumbnail, and the XML file you will create in the next step in a directory named "Planck" in a location where the final URL path is also named "Planck".
You can go ahead and copy the Planck857_AIT_small.png file and the png directory to this location now. See the explanation above for the URL syntax to use to retrieve our instance of these files.
Step 8 Creating the collection XML for WWT:
This file is going to go in the same location as the data copied above, under the name "planck.xml". A variation on the Montage server file shown above, the parts you have to edit are shown in red:<?xml version="1.0" encoding="UTF-8"?>
<Folder Name="Montage Test"
Group="Explorer"
Searchable="True"
Type="Sky"
Thumbnail="http://yourserver.edu/path/Planck/Planck857_AIT_small.png">
<ImageSet Generic="False"
DataSetType="Sky"
BandPass="microwave"
Name="Planck 857 GHz"
Url="http://yourserver.edu/path/Planck/png/Planck{Q}.png"
BaseTileLevel="0"
TileLevels="5"
BaseDegreesPerTile="180"
FileType=".png"
BottomsUp="False"
Projection="Toast"
QuadTreeMap="0123"
CenterX="0"
CenterY="0"
OffsetX="0"
OffsetY="0"
Rotation="0"
Sparse="False"
ElevationModel="False"
StockSet="False">
<ThumbnailUrl>
http://yourserver.edu/path/Planck/Planck857_AIT_small.png
</ThumbnailUrl>
<Credits>
Montage reverse grayscale example made from Planck HEALPIX 857 GHz data.
</Credits>
<CreditsUrl>
http://yourserver.edu
</CreditsUrl>
</ImageSet>
</Folder>
Once you have finished updating it, copy it to the URL space you have already set up.
Step 9 Testing through WWT:
You should now be able to open your copy of the Planck data in WWT. As described above, go to:
http://www.worldwidetelescope.org/webclient/
Opening the menu item
and enter the URL of your XML file:
http://yourserver.edu/path/Planck/planck.xml
We maintain a copy of these files on the Montage server, so you can see the results of the above processing but cutting the following URL and pasting it into the WWT interface:
http://montage.ipac.caltech.edu/workspace/Planck/planck.xml